The Yield Curve Inverted! Remind Me Why I Care?
If you’ve been tuning into the financial news recently, you may be wondering “what is this yield curve inversion and why is it so scary?”
Last week, the stock market dropped sharply when investors were spooked by a yield curve inversion which can be a sign of a looming economic recession. But before one heads out of the investing doors, it’s important to understand inverted yield curves and why it doesn’t necessarily mean doom and gloom for your retirement nest egg.

Who’s Afraid Of The Big Bad Yield Curve?
On Wednesday, August 14th, the yield on the 10-year U.S. Treasury bond dropped below that of the 2-year U.S. Treasury bond. This can be a troublesome sign since it’s implies that investors are willing to accept less interest for a longer-term investment compared to a much shorter-term investment. In a more normal, healthier bond market picture, the yield curve graph slopes upward. However, when investors become skittish about an economic slowdown, the yield curves inverts as shown in the graph below.

Yield curve inversions usually happen when investors are less confident about the future and are looking for safer haven investments like bonds. Stoking investor fears recently have been concerns about the U.S.-China trade dustup and global slowing growth. However, history has shown that an inversion, while not an upbeat signal about the current state of the economy, doesn’t automatically translate to a sustained drop in the stock market.
In fact, over the last 40 years, the stock market has performed well on average at the start of the first yield curve inversion as the table below shows. Also note that the start of a recession has typically been over one year after the first inversion.
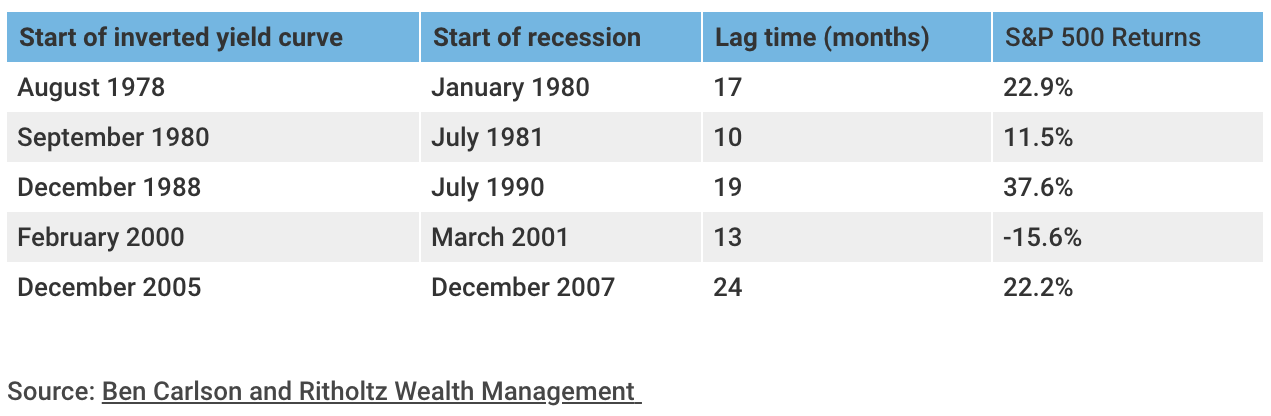
U.S. Recession Scoreboard
When looking at the current state of the economy and comparing it to previous times when the U.S. slumped into a recession, it can be argued that only the yield curve is signaling a possible recession. In previous recessions dating back to 1973, indicators like job growth, manufacturing, earnings quality and the housing market were at or close to recession levels.

Market Timing & Getting It Right Twice
Trying to get in and out of the stock market at exactly the right time to avoid a recession-induced market downturn typically presents investors with nearly insurmountable odds. Markets are incredibly competitive and process information adeptly and with rapid-fire precision. Adding to the difficulty of market timing is that to be successful, one must know when to buy and sell stocks TWICE.
Nobel Laureate, Robert Merton, commented on market timing complexity by saying “Suppose I could verify that I’m a .700 baseball average hitter in calling the market turns. That’s pretty good; you’d hire me right away. But to be a good market timer, you’ve got to do it twice. What if the chances of me getting it right were independent each time? They’re not. But if they were, that’s 0.7 times 0.7. That’s less than 50-50. So, market timing is horribly difficult to do.”
It’s important to take note of the recent yield curve inversion. However, like many indicators, it’s not perfect and doesn’t automatically mean a recession is right around the corner. It does, however, induce ear ringing recession chatter, particularly by the media, which can confuse and scare investors especially since it’s been so long since the last recession. However, it’s never too early to mentally and portfolio prepare for the inevitable economic downturn. By “staying the course” with an investment plan that is proven, suitable and understandable, remains the most important way to achieve investment success over the long term.
David Hone, CFA